skip to Main Content

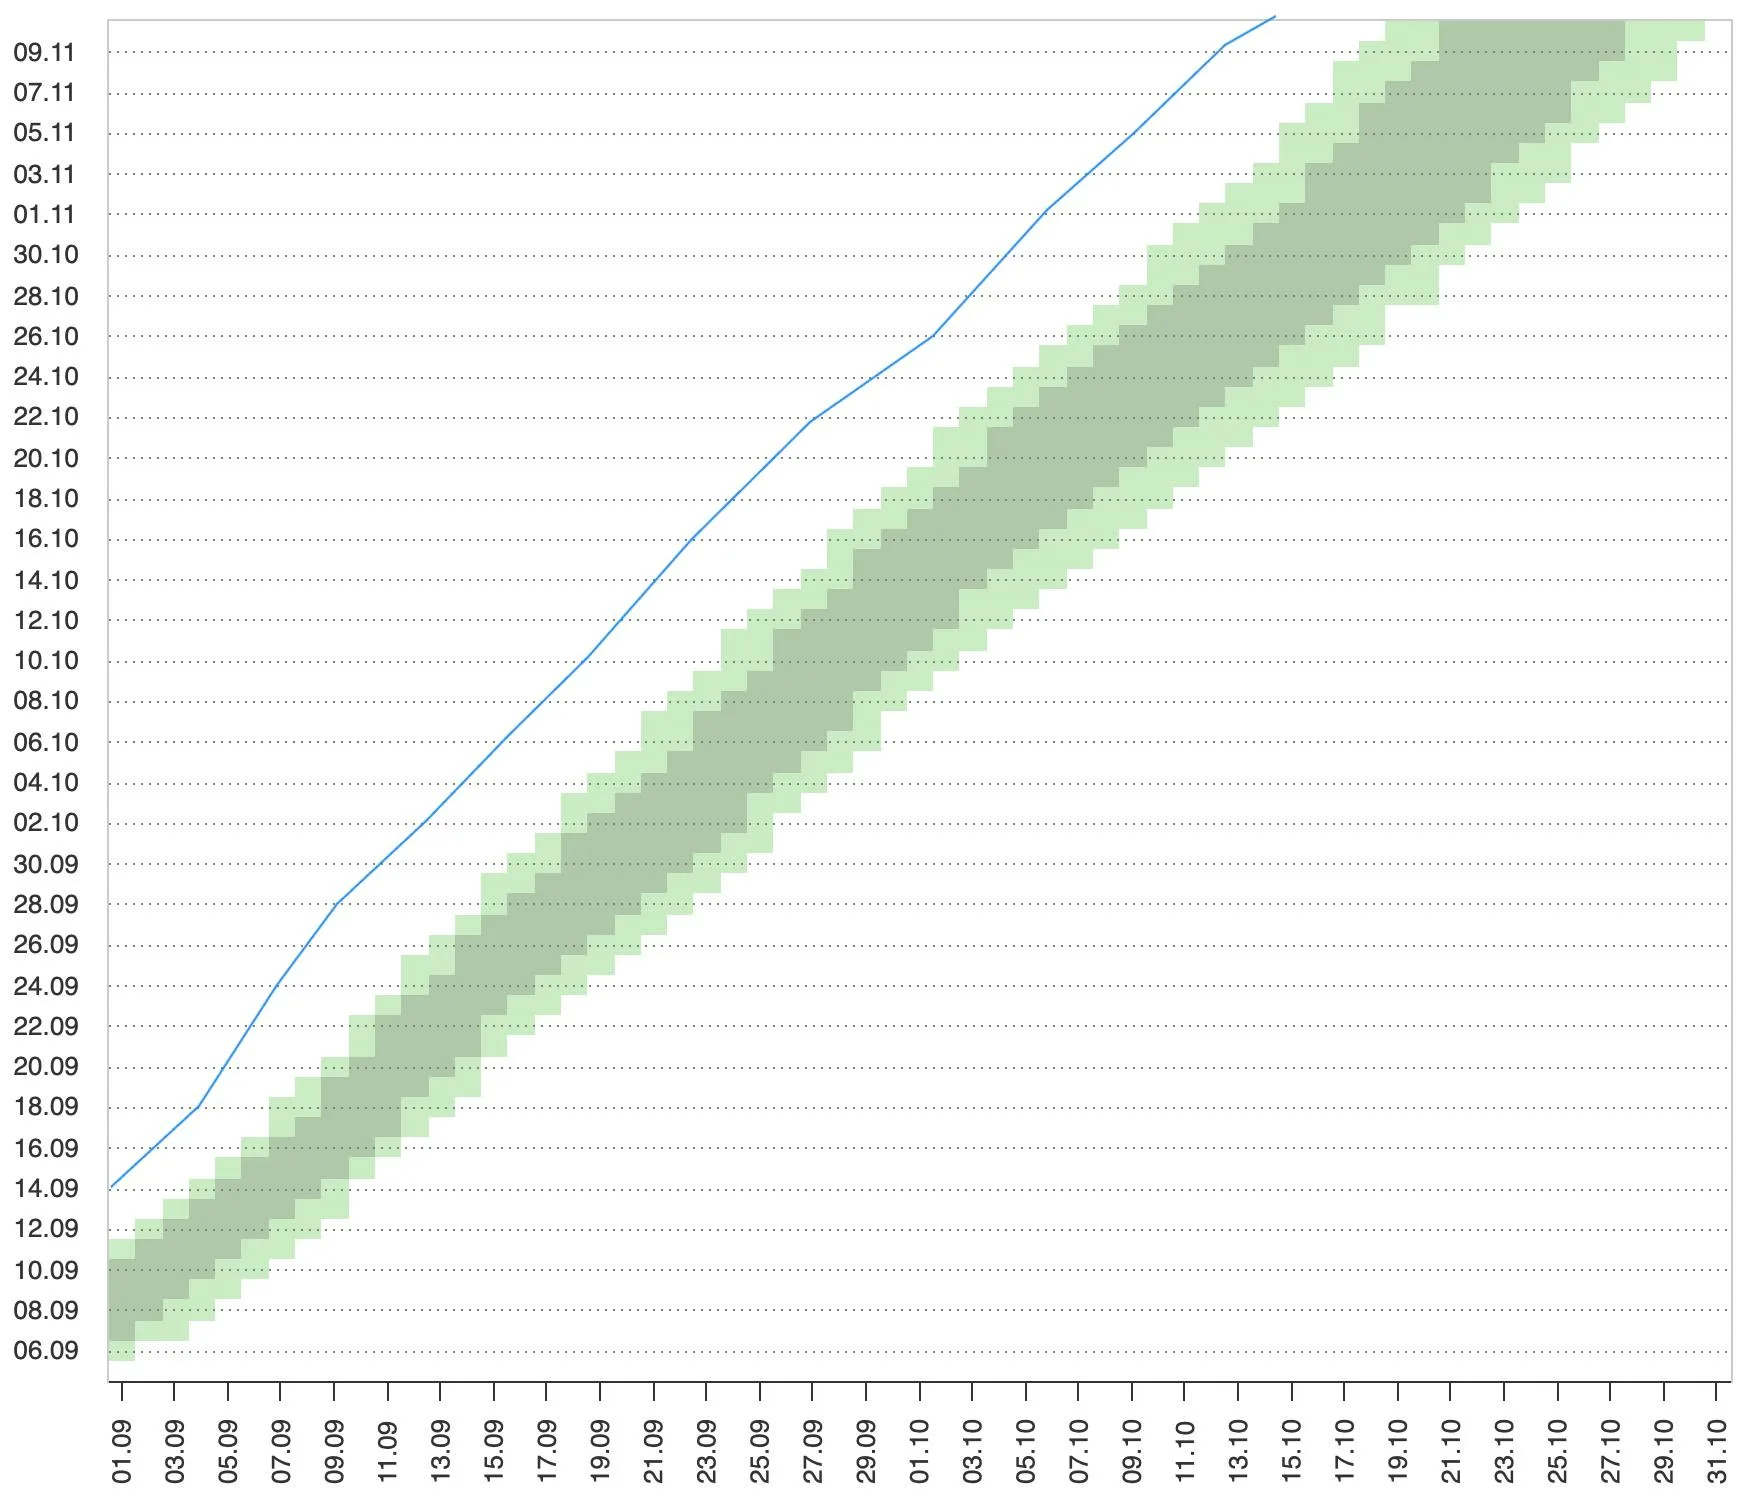
I have a very large heatmap with a 100×100 grid of data in a chart.

I don’t want to display the legend on this chart.

I would like to be able to programmatically, with Javascript, add another line on top of the heatmap whenever a user clicks a specific checkbox on the page where the chart is displayed.

Is this feasible?

EDIT: Below an image create in Photoshop which shows what I would like to have in the end – the line shouldn’t appear when the chart initially loads, but should be added with a checkbox located in the body of the page using Javascript:

enter image description here

Thanks!

2

Answers


  1. You can add logic to point.events.click() that will create a separate graph positioned relative to the point:

    Highcharts.chart('container', {
      ...
      plotOptions: {
        series: {
          point: {
            events: {
              click: function() {
                const point = this,
                  chart = point.series.chart;
    
                if (chart.innerChart) {
                  chart.innerChart.div.remove();
                  chart.innerChart.destroy();
                }
    
                const id = `point-${this.x}-${this.y}`,
                  shape = point.shapeArgs,
                  width = shape.width,
                  height = shape.height,
                  left = chart.plotLeft + point.plotX - width / 2,
                  top = chart.plotTop + point.plotY - height / 2,
                  chartDiv = document.createElement('div');
    
                chartDiv.setAttribute("id", id);
                chartDiv.style.cssText = `
                    background-color: red;
                    position: absolute;
                    top: ${top}px;
                    left: ${left}px;
                    width: ${width}px;
                    height: ${height}px;
                    zIndex: 10;
                `;
    
                chart.container.style.position = 'relative';
                chart.container.appendChild(chartDiv);
    
                chart.innerChart = Highcharts.chart(chartDiv, {
                  title: {
                    text: point.value
                  },
                  exporting: {
                    enabled: false
                  },
                  legend: {
                    enabled: false
                  },
                  credits: {
                    enabled: false
                  },
                  series: [{
                    data: [1, 3, 7]
                  }]
                });
                
                chartDiv.addEventListener('click', function() {
                    chartDiv.remove();
                    chart.innerChart.destroy();
                    delete chart.innerChart;
                })
    
                chart.innerChart.div = chartDiv;
              }
            }
          }
        }
      }
    });
    

    Demo: https://jsfiddle.net/BlackLabel/b0xwr59d/

    Login or Signup to reply.
  2. If you want to combine two series, just add another one to the series array, and to make it appear dynamically using the button, you can first hide it in the settings series.visible: false and use the series.setVisible() method to toggle the visibility:

    const chart = Highcharts.chart('container', {
      ...
      series: [{
        type: 'heatmap',
        ...
      }, {
        type: 'spline',
        color: '#0093ff',
        data: [0, 2.5, 2, 4, 5],
        lineWidth: 3,
        visible: false
      }]
    });
    
    document.getElementById('btn').addEventListener('click', function() {
        chart.series[1].setVisible();
    })
    

    Demo: https://jsfiddle.net/BlackLabel/j0zbv7y2/
    API: https://api.highcharts.com/highcharts/plotOptions.series.visible
    https://api.highcharts.com/class-reference/Highcharts.Series#setVisible

    Login or Signup to reply.
Please signup or login to give your own answer.
Back To Top
Search