 Question posted in

I am looking to create a bar plot in R combining data from 2 different dataframes plus using a third variable as fill.
The data:
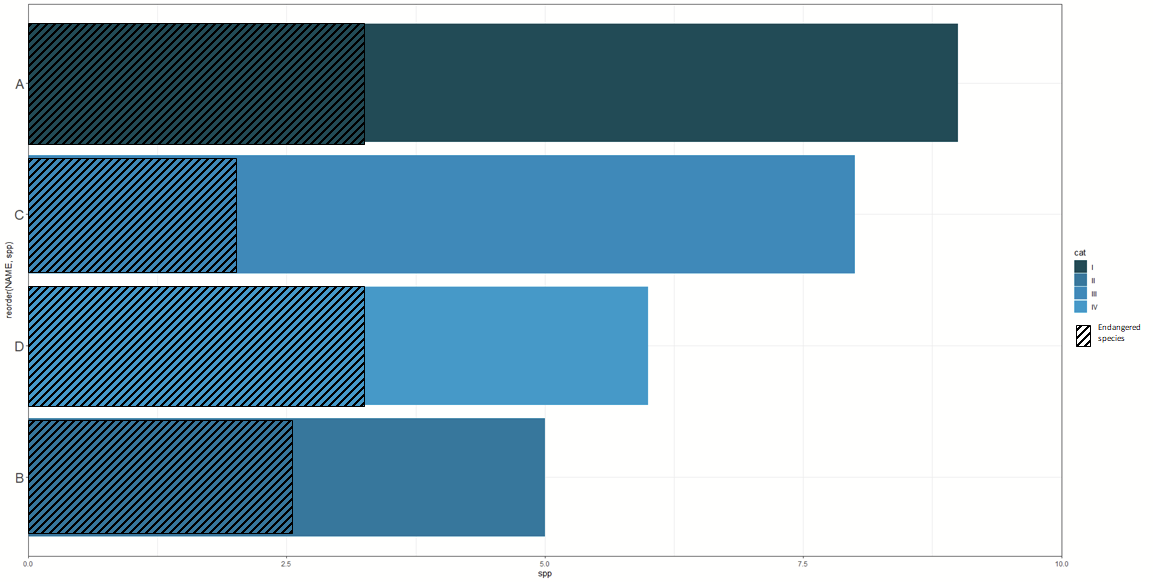
all_spp <- data.frame(NAME=c("A", "B", "C", "D"), spp=c(9, 5, 8, 6), cat=c("I", "II", "III", "IV") )

listed_spp <- data.frame(NAME=c("A", "B", "C", "D"), en_spp=c(1, 3, 2, 3) )
The data depict protected areas (NAME), the total number of species (spp) versus endangered species (en_spp) and the protection levels of the protected areas (cat). I am trying to create a bar plot depicting total number of species (x=spp) by protected area (y=NAME) coloured in the respective fill for the protection level (fill=cat). On top of each bar per area I would like to show the endangered species (x=en_spp) as a hashed bar.
I have tried combining the two dataframes and using the melt function, however, that does not allow me to use fill=cat, nor does it add a corresponding correct legend.
This is the code I have been trying to use but does not work
ggplot(data=all_spp, aes(x = spp, y = reorder(NAME, spp), fill=cat),) +
  geom_bar(stat = "identity", position="stack") +
  geom_bar(listed_spp, mapping=aes(x=en_spp, y=reorder(NAME, en_spp))) +
  scale_x_continuous(limits = c(0,10), expand = c(0, 0)) +
  theme_bw() +
  theme(axis.text.y=element_text(size=18)) +
  scale_fill_manual(breaks=c("I", "II", "III", "IV"),
                    values = c("I" = "#004B57",
                               "II" ="#007AA2",
                               "III" = "#008DC0",
                               "IV" = "#009DCF"))
Below a photoshopped graph depicting the output I am looking for:
Any ideas for a solution would be appreciated.
2
Answers
You can use the
ggpatternpackage to do this. It’s much like this answer, but with a tweak for the two different datasets.Created on 2024-02-02 with reprex v2.0.2
To reproduce your example plot, this will work. You example uses
scale_pattern_manual()to replicate your example pattern. See this link for more information.